Understanding Negative and Positive Divergences in the Market
The article is not titled with satire. Today I discuss positive and negative divergences
In the world of stonk market analysis, divergences are powerful indicators that can provide valuable insights into potential market movements. Divergences occur when the price of an asset moves in the opposite direction of a technical indicator, suggesting a possible reversal or continuation of the current trend. There are two main types of divergences: negative (bearish) and positive (bullish). This article will explore the concepts of negative and positive divergences, how to identify them, and how traders can use them to make informed decisions in the market.
A divergence occurs when the price of an asset and a technical indicator move in opposite directions. Technical indicators commonly used to identify divergences include the Relative Strength Index , and pretty much majority of oscillators. Divergences can signal potential changes in the strength or direction of a trend.
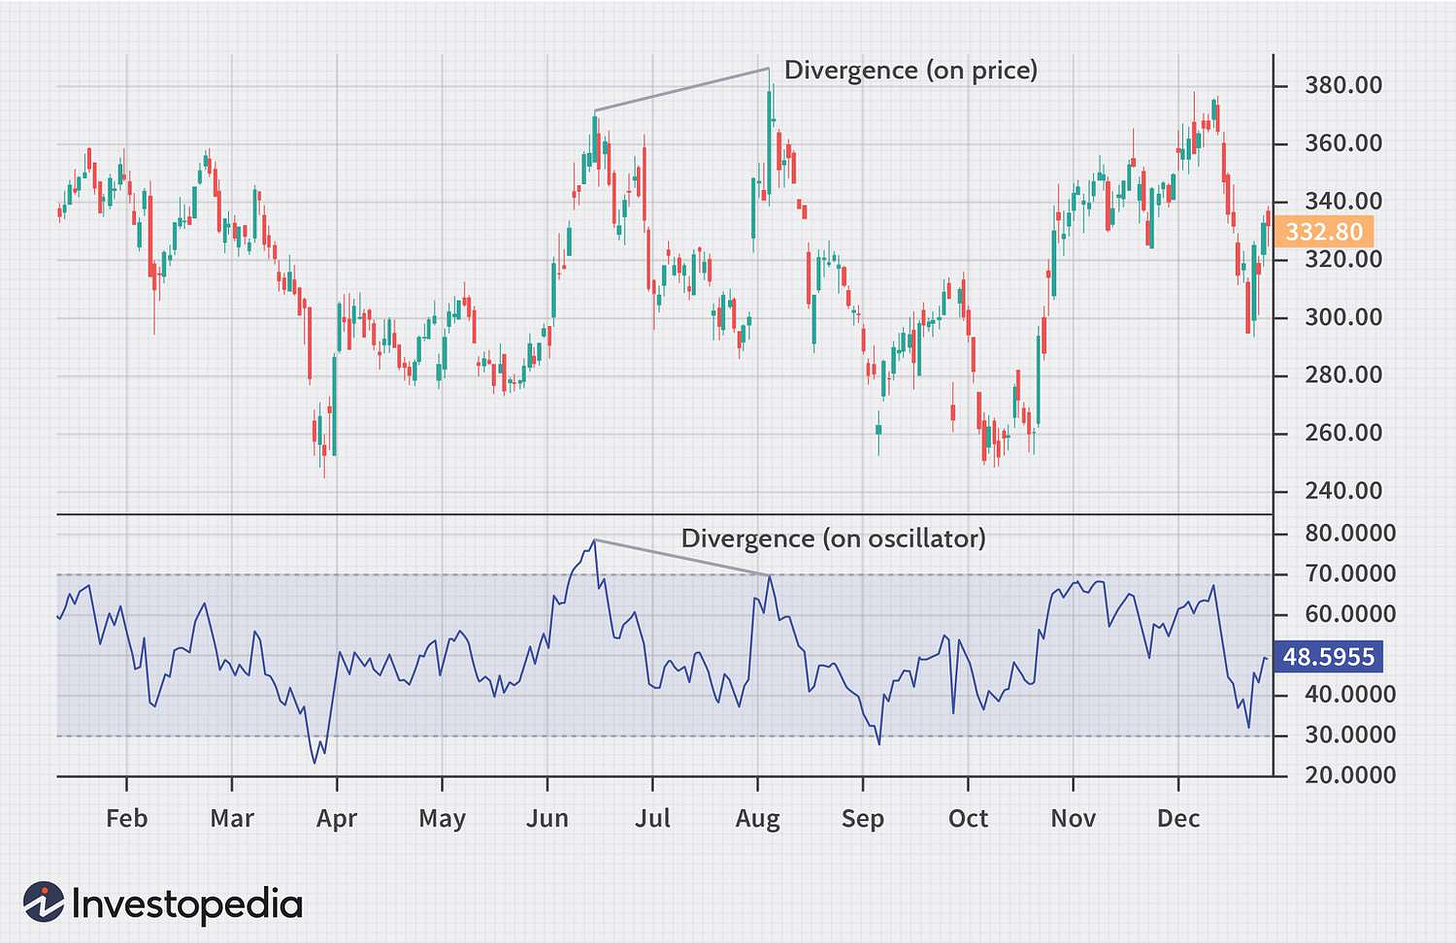
The more popular among the 2 is negative divergence. This occurs when the price of an asset is making higher highs, but the technical indicator is making lower highs. It suggests that the upward momentum is weakening and a bearish reversal may be imminent.
Then there is positive divergence.This occurs when the price of an asset is making lower lows, but the technical indicator is making higher lows. It indicates that the downward momentum is decreasing and a bullish reversal may be on the horizon.
Identifying Negative Divergence
Negative divergence is typically identified using oscillators like RSI. Here’s how to spot it: When the price makes a higher high but the RSI makes a lower high, it signals a negative divergence.This indicates that although the price is rising, the underlying strength is weakening. Indication is not, the green light to start a trade, sorry youtubers.
Negative divergence often precedes a bearish reversal. Here’s why: As the indicator fails to match the price's higher high, it suggests that the buying power is diminishing. Negative divergence often occurs when the asset is overbought, meaning a correction is likely. Its the accumulation of these signals that indicate the current uptrend is losing steam and a reversal to the downside may occur.
Practical Examples
Stock Market:
Suppose a stock is in a strong uptrend, making higher highs. The RSI, however, starts forming lower highs. This negative divergence could indicate that the stock's uptrend is weakening, and a reversal might be imminent.
Forex Market:
In the forex market, if a currency pair is making higher highs, but the Oscillator is forming lower highs, it signals negative divergence. Traders might prepare for a potential bearish reversal.
Wait for confirmation of the trend reversal before taking a position. This can be done by looking for bearish candlestick patterns or additional technical indicators. Place stop-loss orders above recent highs to manage risk. This helps protect against false signals and unexpected market movement. Set profit targets based on support levels or use trailing stops to lock in profits as the price moves in the anticipated direction.
Or you could not risk shorting it, but wait out the downfall to buy a dip instead.
Identifying Positive Divergence
Positive divergence is also identified using oscillators like RSI.When the price makes a lower low but the RSI makes a higher low, it signals a positive divergence. This indicates that although the price is falling, the underlying strength is improving.
Positive divergence often precedes a bullish reversal. Here’s why: As the indicator fails to match the price's lower low, it suggests that the selling power is diminishing. Positive divergence often occurs when the asset is oversold, meaning a bounce or reversal is likely. It signals that the current downtrend is losing steam and a reversal to the upside may occur.
Practical Examples
Stock Market:
Suppose a stock is in a strong downtrend, making lower lows. The RSI, however, starts forming higher lows. This positive divergence could indicate that the stock's downtrend is weakening, and a reversal might be imminent.
Forex Market:
In the forex market, if a currency pair is making lower lows, but the MACD is forming higher lows, it signals positive divergence. Traders might prepare for a potential bullish reversal.
Wait for confirmation of the trend reversal before taking a position. This can be done by looking for bullish candlestick patterns or additional technical indicators. Place stop-loss orders below recent lows to manage risk. This helps protect against false signals and unexpected market movement. Set profit targets based on resistance levels or use trailing stops to lock in profits as the price moves in the anticipated direction.
Integrating Divergence Analysis with Other Tools
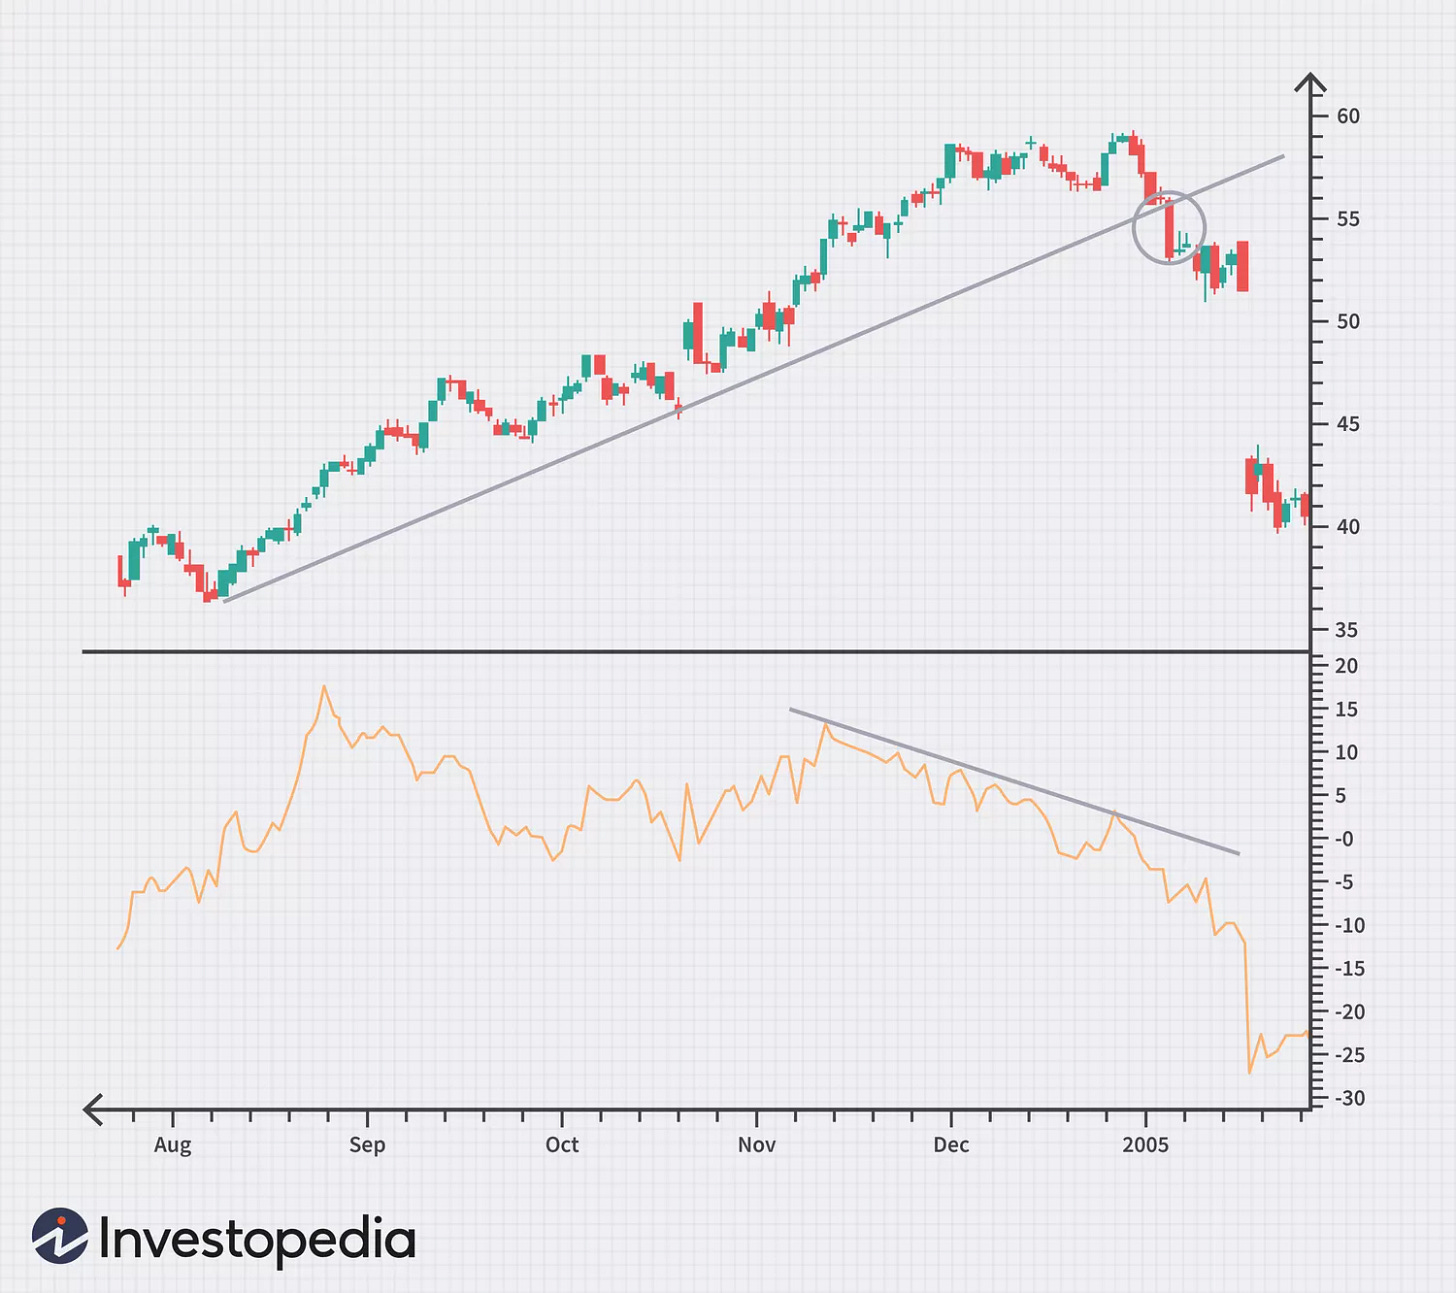
Divergence analysis is statistically more effective when paired with other data. Draw trend lines on both the price chart and the indicator. Divergence along with a trend line break can provide a stronger signal of a potential reversal. Identify chart patterns such as double tops, double bottoms, head and shoulders, or triangles. Divergence occurring near the completion of these patterns can add confidence to the signal.
Using Multiple Time Frames
Analyzing divergences across multiple time frames can enhance the reliability of the signals. Confirm the presence of divergence on higher time frames (daily, weekly) to identify major trend reversals. Use lower time frames (hourly, 4-hour) to fine-tune entry and exit points based on divergence signals.
Psychological Aspects of Trading Divergences
Patience and Discipline
Trading divergences requires patience and discipline. As premature entries can lead to losses. Wait for confirmation signals before taking position. Developing a trading plan with clear entry, exit, and stop-loss levels. Stick to this plan to avoid emotional decision-making.
Risk Management
Effective risk management is crucial when trading divergences.Use proper position sizing to manage risk. Avoid over-leveraging, which can lead to significant losses. Always use stop-loss orders to protect against unexpected market movements and to limit potential losses.
Keeping Emotions in Check
Emotions can cloud judgment and lead to impulsive decisions. Do not chase every divergence signal. Focus on high-probability setups and avoid overtrading. Accept that not every trade will be profitable. Learn from losses and avoid revenge trading to recover losses.
Conclusion
Negative and positive divergences are valuable tools in a trader’s arsenal, offering insights into potential trend reversals and continuations. By understanding how to identify and interpret these divergences using indicators like RSI, and other oscillators, traders can enhance their market analysis and make more informed decisions. Integrating divergence analysis with other technical tools, using multiple time frames, and confirming signals with volume further strengthens the reliability of divergence signals.
Successful trading of divergences also requires patience, discipline, effective risk management, and emotional control. By incorporating these elements into their trading strategy, traders can leverage the power of divergences to improve their trading performance and achieve long-term success in the market.


